
What "Living Comfortably" Actually Costs

Living comfortably means something different depending on your zip code. In some metro areas, a six-figure income barely covers rent, groceries, and taxes. In others, half that amount goes a long way. Cost-of-living gaps between American cities are wide enough that the definition of financial comfort can vary by tens of thousands of dollars a year, depending on where someone lives.
CouponFollow compared cost-of-living data for the 100 largest U.S. metro areas, factoring in housing, food, transportation, healthcare, other necessities, and taxes, then measured those costs against local median incomes. Explore exactly how much money it takes for a single adult to live comfortably in each metro, and how far short many paychecks fall.
Key Takeaways
- San Jose-Sunnyvale-Santa Clara, CA, requires the highest annual income to live comfortably ($91,359), followed by Santa Ana-Anaheim-Irvine, CA ($83,438) and New York, NY ($83,262).
- McAllen-Edinburg-Mission, TX, requires the lowest annual income ($40,837), followed by El Paso, TX ($41,190).
- New York, NY, has the toughest affordability gap overall, with median single-person income covering just 61.3% of what's needed to live comfortably there.
- Tacoma, WA, has the easiest affordability gap, with income covering 109.2% of what's needed.
- The metro areas with the highest housing costs (rent + utilities) are San Jose-Sunnyvale-Santa Clara, CA ($31,296), New York, NY ($28,872), and Santa Ana-Anaheim-Irvine, CA ($28,224).
How All 100 Metros Rank on the Cost of Comfort
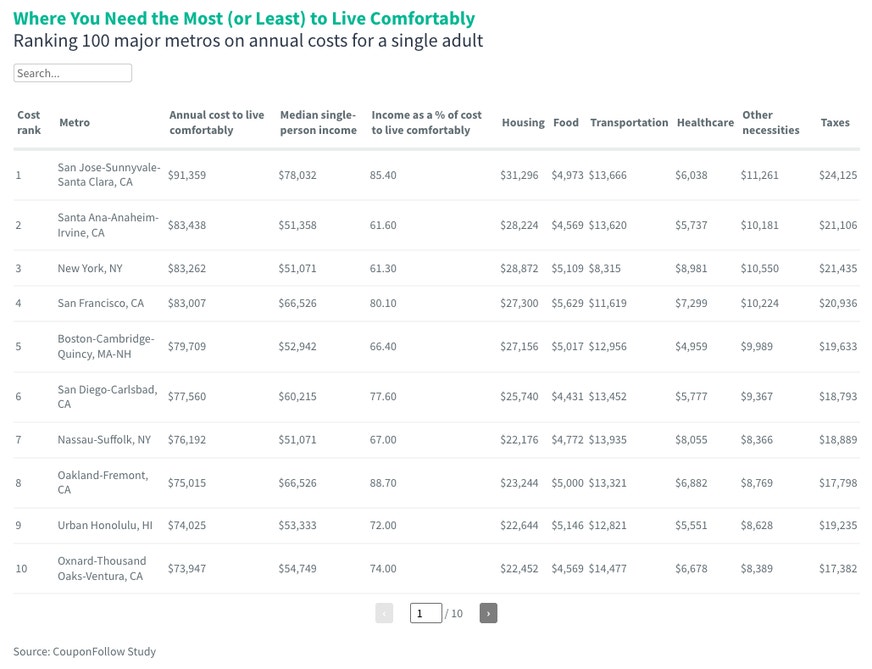
This interactive ranking sorts all 100 metros by the total annual income a single adult needs to live comfortably. Alongside each metro's cost, it shows the local median single-person income and the share of that comfortable budget the income actually covers, so you can search any metro and see how it stacks up.
https://public.flourish.studio/visualisation/29732463/
Here's where the income needed to live comfortably lands across the country:
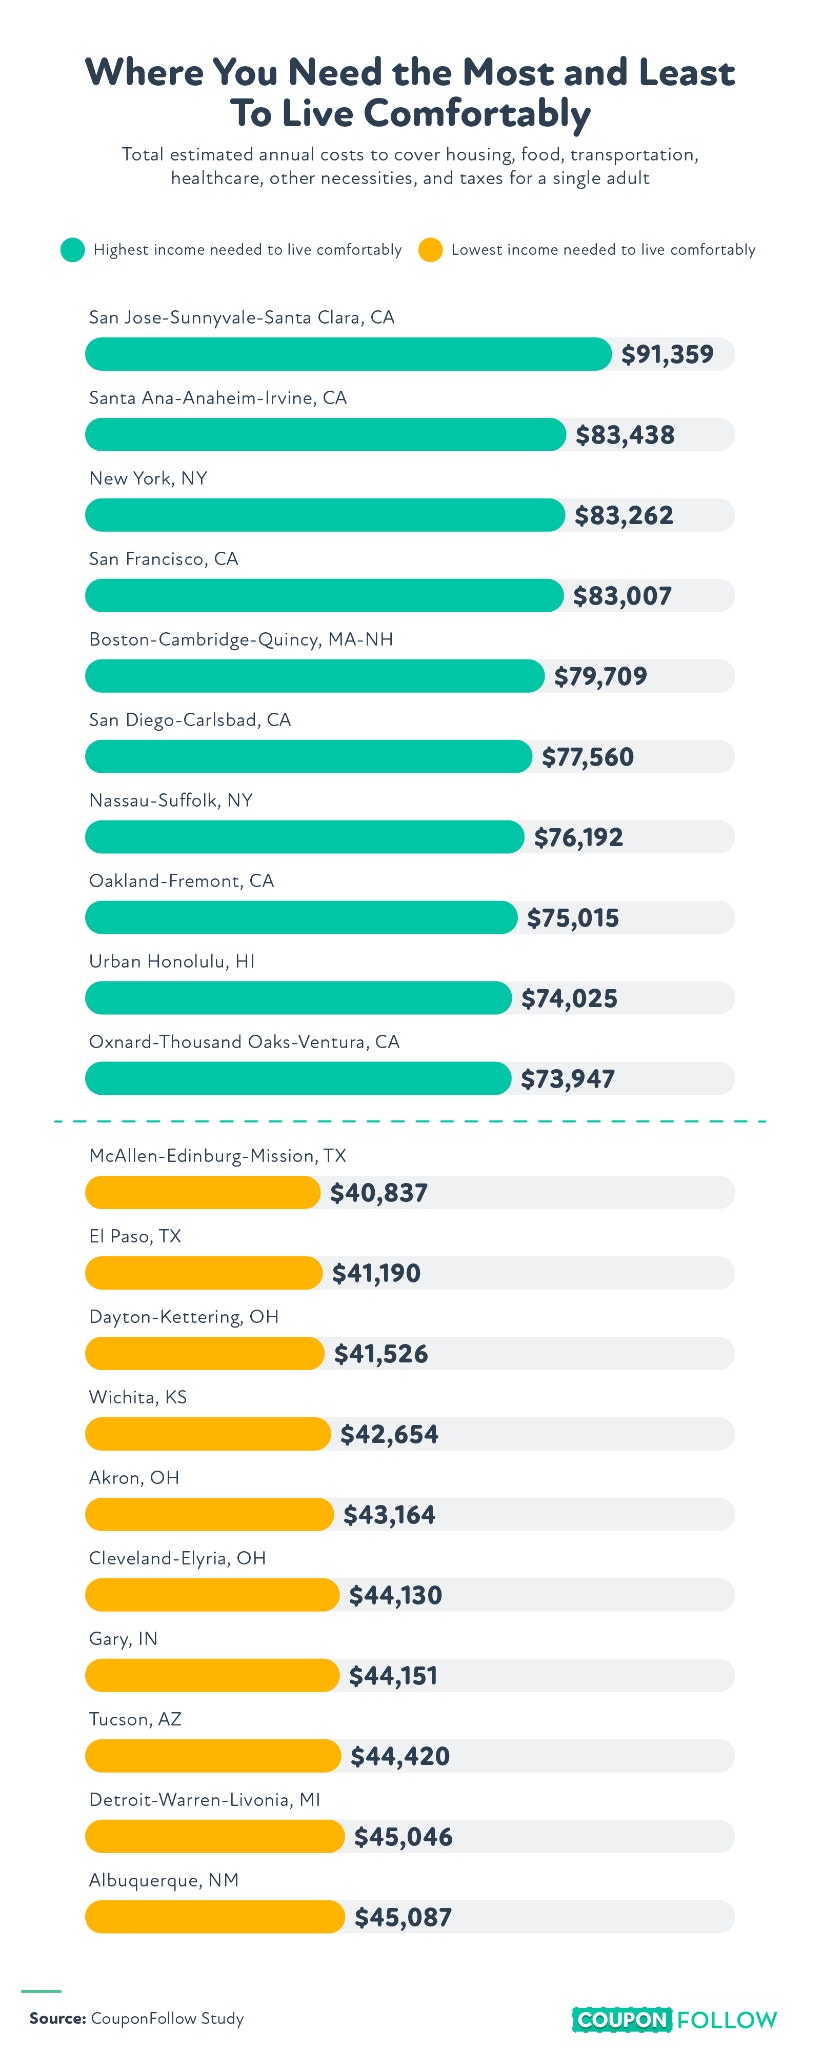
- San Jose-Sunnyvale-Santa Clara, CA, tops the list, requiring $91,359 a year to live comfortably, the highest of any metro in the analysis.
- Santa Ana-Anaheim-Irvine, CA ($83,438), New York, NY ($83,262), San Francisco, CA ($83,007), and Boston-Cambridge-Quincy, MA-NH ($79,709) round out the top 5 priciest cities.
- McAllen-Edinburg-Mission, TX, requires the least, at $40,837 a year, followed by El Paso, TX ($41,190), Dayton-Kettering, OH ($41,526), Wichita, KS ($42,654), and Akron, OH ($43,164).
- New York, NY, has the toughest affordability gap of any metro. Median single-person income there covers just 61.3% of what's needed to live comfortably, with Riverside-San Bernardino-Ontario, CA (61.5%) and Santa Ana-Anaheim-Irvine, CA (61.6%) not far behind.
- Tacoma, WA, has the easiest financial cushion, with median income covering 109.2% of what's needed to live comfortably there, followed by Gary, IN (108.2%) and Austin-Round Rock, TX (104.3%).
Among the 100 largest metro areas, the total cost of a comfortable single-adult budget ranges from about $40,800 to more than $91,000 a year. These are the 10 metros where you need the most and the 10 where you need the least.
The Gaps in Cost by Category
The breakdown below shows the three highest and three lowest metros across housing, food, transportation, healthcare, other necessities, and taxes.
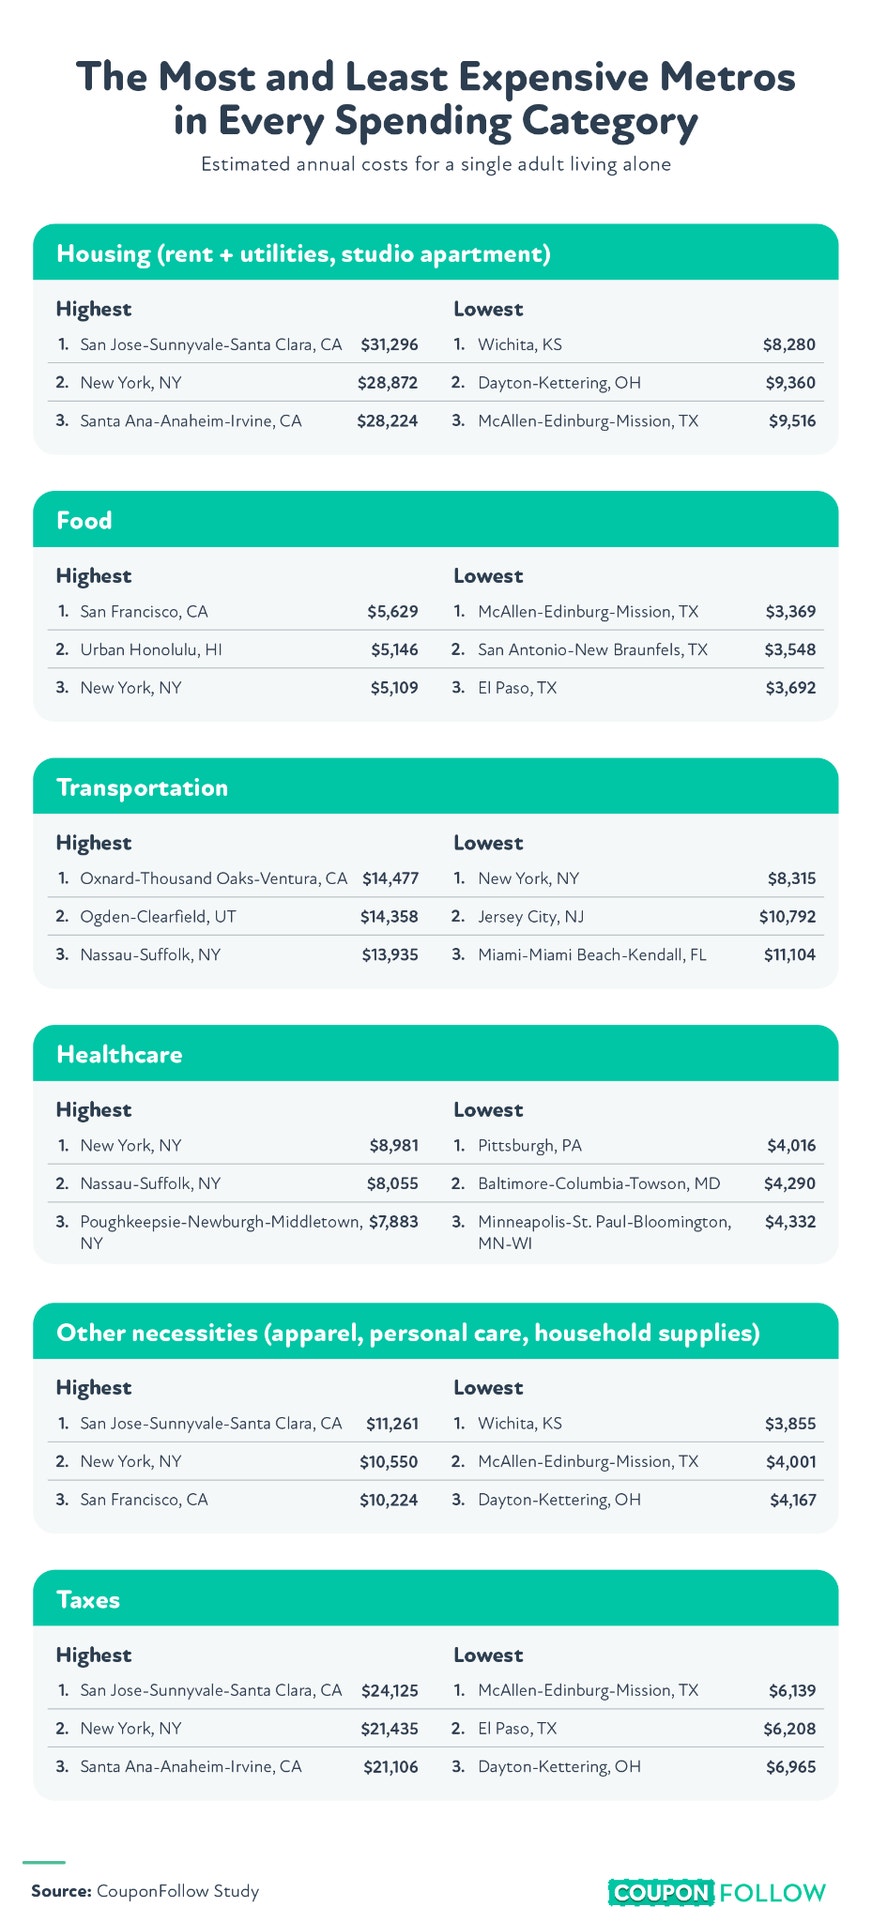
Here's how the individual cost categories break down across metros:
- Housing (rent and utilities) costs the most in San Jose-Sunnyvale-Santa Clara, CA ($31,296), New York, NY ($28,872), and Santa Ana-Anaheim-Irvine, CA ($28,224). Wichita, KS, has the lowest housing costs, at $8,280.
- Healthcare costs peak in New York, NY ($8,981), Nassau-Suffolk, NY ($8,055), and Poughkeepsie-Newburgh-Middletown, NY ($7,883). Pittsburgh, PA, has the lowest, at $4,016.
- Food costs run highest in San Francisco, CA ($5,629), Urban Honolulu, HI ($5,146), and New York, NY ($5,109). McAllen-Edinburg-Mission, TX, has the lowest, at $3,369.
- Transportation costs peak in Oxnard-Thousand Oaks-Ventura, CA ($14,477), Ogden-Clearfield, UT ($14,358), and Nassau-Suffolk, NY ($13,935). New York, NY, despite its high overall cost of living, has the lowest transportation costs, at $8,315.
- Other necessities cost the most in San Jose-Sunnyvale-Santa Clara, CA ($11,261), New York, NY ($10,550), and San Francisco, CA ($10,224). Wichita, KS, has the lowest, at $3,855.
- Taxes are steepest in San Jose-Sunnyvale-Santa Clara, CA ($24,125), New York, NY ($21,435), and Santa Ana-Anaheim-Irvine, CA ($21,106). McAllen-Edinburg-Mission, TX, carries the lightest load, at $6,139.
The Price of Comfort Isn't Standing Still
The price of comfort varies dramatically depending on where you live, and that gap isn't closing anytime soon. Coastal metros with high housing costs continue to demand the highest paychecks, while smaller Midwest and Southern metros remain among the most affordable places to stretch a dollar. Wherever you land on that spectrum, knowing your area's real cost of comfortable living, not just survival, can help you set more realistic income and savings goals.
Methodology
This analysis is based on the Economic Policy Institute's Family Budget Calculator (2026), which estimates the annual cost of housing, food, transportation, healthcare, other necessities, and taxes for a single adult living alone. Figures reflect the 100 largest U.S. metro areas as designated by EPI.
To assess affordability, these cost estimates were compared against median single-person household income from the U.S. Census Bureau's American Community Survey (2024 1-Year Estimates). Where EPI's dataset lists an area for which the Census Bureau does not separately publish single-person income data, the income figure from the encompassing metro area was applied.
About CouponFollow
CouponFollow helps shoppers find real-time discount codes and money-saving tips for thousands of stores, so everyday purchases cost less. As the cost of a comfortable life rises across the country, small savings on routine purchases can add up to real breathing room in a monthly budget. Check CouponFollow for the latest deals before your next purchase.
Fair Use Statement
Feel free to share this research for noncommercial purposes. If you do, please credit CouponFollow and link back to this page so readers can see the full data and methodology.