
blog posts
35+ Eye-Opening Online Shopping Statistics for 2022

8 min reads
What do you do when you have extra cash?
Maybe you're one of the 39% of Americans who prioritize saving for unexpected hardship or the 16% who prioritize retirement savings (Source: Statista).
Of course, being able to save at all is a luxury. For the 21% of Americans who aren’t saving anything, the most common reason is that they simply have too many other expenses (Source: Bankrate).
This article gives the full picture of American savings habits — how much people in the US save, which groups save the most and the least, and how the state of American savings has changed during the COVID-19 pandemic.
Let’s start with the basics. How much does the average American have in savings? Is it enough? And why can’t people in the US save more?
(Source: BEA)
The personal savings rate is the average amount that people save after paying their other expenses. It varies greatly between countries. South Korea and Japan, for example, have much higher savings rates than the US at 35.8% and 22.3%, respectively.
But the American savings rate isn’t the lowest in the world. Finland has a personal savings rate of only 2.9%, while Cyprus has a rate of 3.11% (Source: Trading Economics).
The savings rate also changes over time. As we’ll see below, the pandemic had a significant effect on US savings.
(Source: Bankrate)
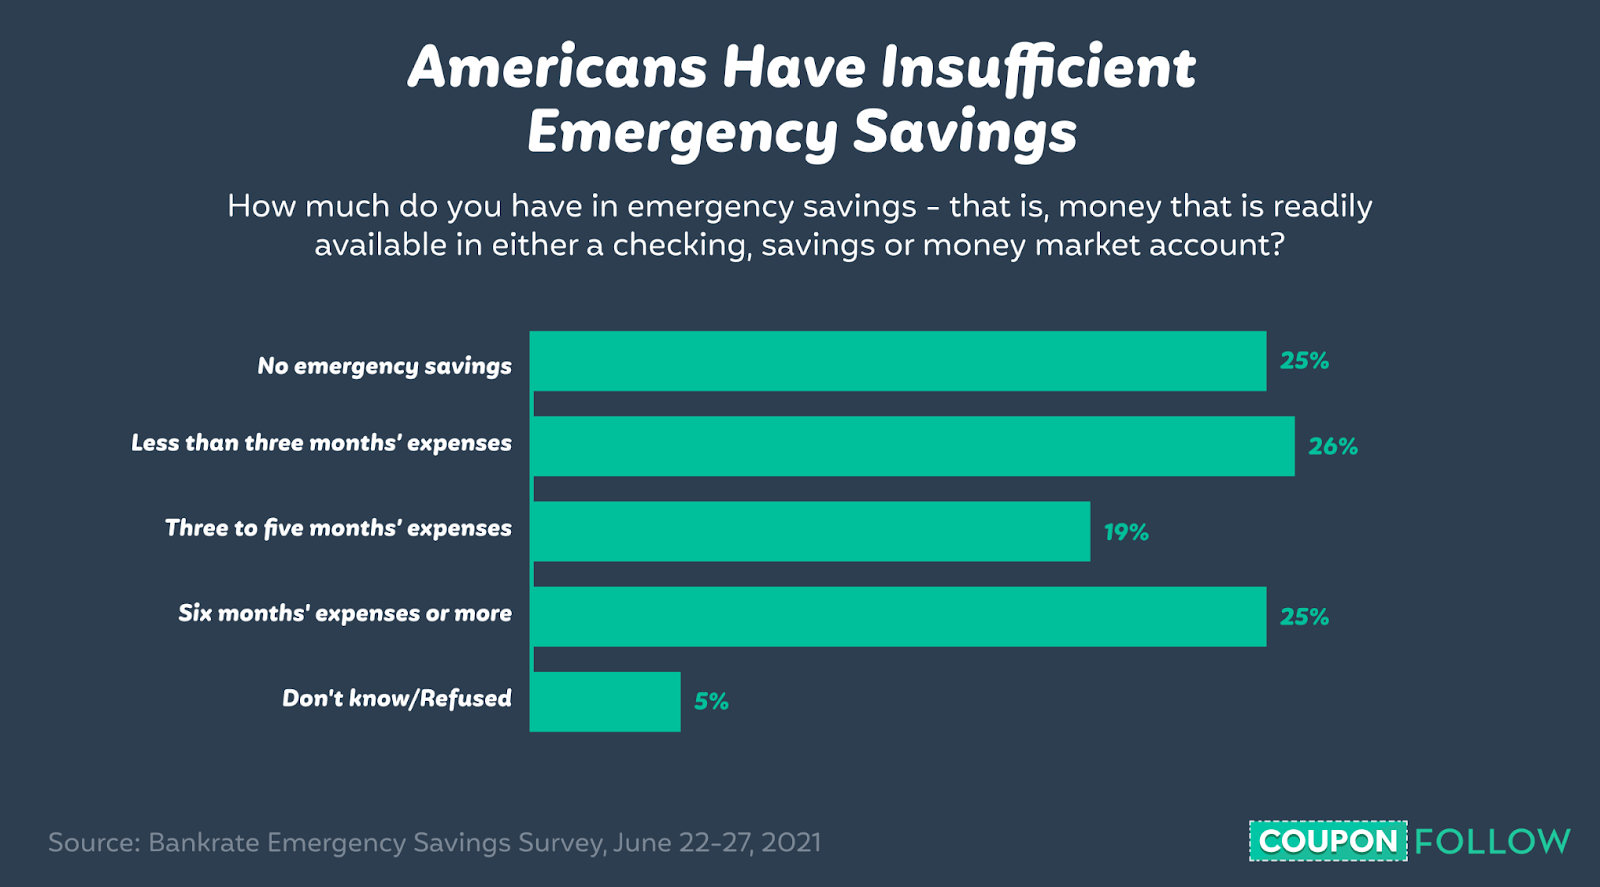
One of the biggest reasons to save is so that unexpected emergencies won't be financial disasters.
Unfortunately, most Americans will be in trouble if something goes wrong. 25% have no emergency savings at all, and another 26% have less than three months’ worth of expenses covered.
Only 25% could expect their savings to last at least six months.
While there have always been people with insufficient emergency savings in the US, their numbers have grown due to the pandemic. 34% of Americans have less in their savings accounts than before COVID-19.
(Source: The Ascent)
Just how much does the typical person keep in their savings account?
The median amount is $3,500.
The mean is $26,619, reflecting the fact that some very wealthy people skew the average. But most Americans don’t have anywhere near that much. 56% have $5,000 or less in savings, while a third have $1,000 or less.
Considering that the average American’s monthly expenses are $5,102, very few people have a significant safety net.
Only 4.38% have over $100,000 in their savings account.
(Source: YouGov)
A survey asked Americans and people from 16 other countries about their top three financial priorities.
39% of respondents put saving for unexpected hardships on their list. 16% listed saving for retirement. The most common answer was ensuring regular financial commitments at 42%. Paying off debt was chosen by 39%, making it just as common as saving for emergencies.
The pattern looks a lot different in other countries. Only 12% of people in Hong Kong are concerned with paying off debt, while 31% save for retirement. Over twice as many Italians as Americans prioritize getting back to pre-pandemic spending levels.
(Source: Statista)
After unexpected emergencies, the type of savings that Americans prioritize most is retirement savings. And 30% of US households are lucky enough to have at least $250,000 saved.
But many don’t have so much — or any savings at all.
(Source: Statista)
A small number of American households have nothing saved for retirement.
31% have $50,000 or less saved. With average monthly expenses of over $5,000, that’s not going to last long in retirement.

(Source: CNBC)
One reason a lot of Americans don’t have a high savings rate is that debt is common. The average household in the US has $90,460 in debt. This includes all types of debt, like credit card debt, mortgages, and student loans.
The fastest-growing areas of debt in 2020 were student loans, which increased 12% year over year, mortgages (7%), and personal loans (6%). Credit card debt, on the other hand, dropped by 9% (Source: Debt.org).
(Source: ValuePenguin)
College degrees aren’t cheap in the US, and that affects how much Americans can save for years after they finish school.
44.7 million Americans have student loan debt. The average college debt among these borrowers is $32,731.
More than 600,000 student loan borrowers in the US have over $200,000 in student debt. The group with the most outstanding debt isn’t recent grads but people ages 30-39.
The high amount of student debt in the US will be relevant in the next group of statistics — American savings by age.
Savings look different at different stages of life. Americans nearing retirement age have different savings concerns than younger people saving for their first home.
The next set of statistics looks at savings by age group.
(Source: Statista)
It’s probably not surprising that the age brackets with the most money in their retirement accounts are the ones nearing retirement. 55-59 year olds have $223,493 in retirement savings, while those 60-64 have $221,451.
People in these groups have had longer to save than the younger generations, and they haven’t started spending their retirement money yet as the older groups have.

(Source: Bank of America)
Millennials may have a long way to go before retirement, but many of them are already prioritizing retirement savings. Millennials got an earlier start than the generations that came before them.
On average, Millennials started saving for retirement at 24, while Gen X started at 30, and the Boomers didn’t start until 33.
(Source: Ameritrade)
People in every generation share a common stress — they feel behind in saving for retirement.
Boomers, the age group most likely to be retired or nearing retirement, is the group with the most confidence in their savings. But even in that generation, 51% feel behind.
66% of Millennials and 73% of Gen X feel the same.
However, the reasons for feeling behind are somewhat different. Millennials cite housing costs as the top reason they can’t save for retirement, while Boomers and Gen X blame it on inadequate income.
Some other reasons that are significant for all three generations include healthcare costs and supporting family members financially.

(Source: CNBC)
Maybe one reason that Gen X is the most worried about retirement savings is that their debt is the highest. The average Gen X member owes $135,841.
In second place, Boomers have an average of $96,984 of debt. Millennials owe $78,396, the Silent Generation owes $40,975, and Gen Z has a debt of just $9,593.
Gen X has the most credit card debt, auto loan debt, and mortgage debt. Boomers have the highest personal loan debt.
(Source: Bank of America)
The main thing that Millennials are saving for is retirement. 75% of them are putting away funds for that purpose. Next comes emergencies (51%) and travel (42%). 32% are saving for a new or different home.
But homeownership is a bigger goal for the younger generation. 41% of Gen Z and 40% of younger Millennials are saving to buy a home.
Savings and spending habits vary between regions. This next section of statistics looks at how different US states compare and how the US compares to other countries.
(Source: CNBC)
According to personal finance app data, people in Connecticut have an average of $523,568 in retirement savings. Residents of Utah have $300,392.
These numbers are likely high because they come from people who are interested in using an app to budget and invest. We’ve already discussed that almost a third of Americans have $50,000 or less in retirement savings.
Still, the app data lets us see some patterns. Four of the five states with the highest retirement balances are on the East Coast. None of the five states with the highest cost of living made the cut — it’s hard to save when your expenditures are so high.
(Source: Credit Karma)
In Washington, DC, the average person has $84,380 in debt, while the typical West Virginian owes $28,790.
If debt can easily be covered by income, it’s not always a big deal. But if we look at the debt-to-income ratio, Washington, DC still loses. DC residents have 9% more debt than their income can cover, while people in West Virginia make 35% more money than they owe.

(Source: Finder)
Out of the 34 countries of the Organisation for Economic Cooperation and Development (OECD), the US ranks 15th in terms of disposable income saved.
Sweden, Germany, and Switzerland are the best savers. Three countries — New Zealand, Latvia, and Greece — spend more than they save.
When the coronavirus pandemic struck in 2020, many American households had to dig into emergency savings they thought they’d never need.
But the pandemic had a positive effect on some American families’ savings. People stayed home instead of shopping, going to events, or eating at restaurants, which led to more disposable income going into savings accounts.
These stats show how the pandemic affected American savings.
(Source: Statista)
In 2018, the American personal savings rate was 8.8%. In 2019, it was 7.6%.
But in 2020, Americans suddenly started to save 13.7% of disposable personal income — a record high. The change was due to the COVID-19 pandemic.
In some cases, people intentionally saved more money out of caution. For other Americans, increased savings were a result of not being able to shop or travel as much. Stimulus checks and a rising stock market also meant that some people had more money to save.
But as we mentioned at the beginning of this article, the current personal savings rate is 6.9%, showing that savings habits are back to pre-pandemic norms.
(Source: Statista)
In the first year of the pandemic, American households saved money due to avoiding typical pre-pandemic activities.
Avoiding major purchases, like cars, was the biggest source of savings at $5,693 per household. American households also saved an average of $1,411 by not traveling.
Other sources of savings included not paying for childcare, not going out to eat, and not attending weddings.

(Source: CNBC)
The statistics above may make it seem like increased savings are a rosy side of the pandemic. Unfortunately, only some American households benefited.
Higher-income households did save more, but lower-income houses saved less than before.
Out of households with annual incomes less than $50,000, 36% say they now have less savings than pre-pandemic. Only 13% say they have more. But out of those with incomes of $100,000 or more, 41% say they now have more money set aside, and only 20% have less.
There’s also a disparity between men and women. 48% of men 35-44 now have more saved than they did before the pandemic, but only 20% of women that age say the same. One reason could be that 55% of men got a bonus in the last year and 44% got a raise. For women, those numbers are 30% and 28%.
The majority of Americans don’t have sufficient emergency savings, and many don’t have any savings at all. It can be hard to save, given the rising cost of living, but being frugal helps.

